RF Insights: August Market Update
Grayson Daniels, VP of Grain Sales and Procurement, breaks down the latest for rice and soybean markets.

Rice Fundamental Highlights
- The August 12 NASS Crop Production report showed updated acreage based on FSA certified acres. U.S. long grain acres are down 34% compared to last year. Arkansas’ total rice acres are projected at 901,000, up from 851,000 in the June survey, but still the lowest since 1977. Medium grain acres are up 16% in Arkansas, but down 3% in California.
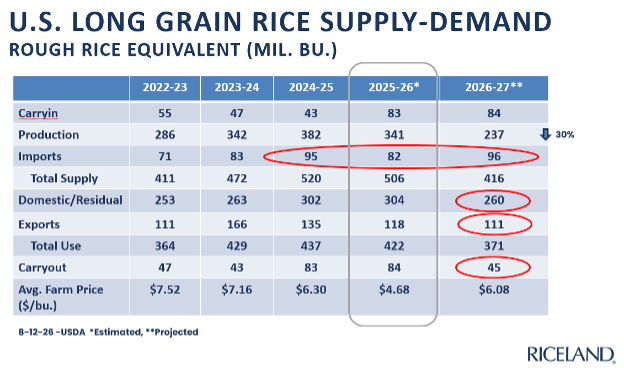
- The August WASDE report decreased old crop exports from 120 million bushels down to 118 million bushels. Old crop ending stocks increased to 83.6 million bushels, slightly above the previous crop.
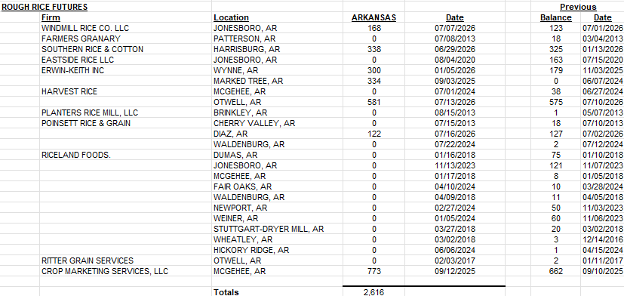
- CBOT certificates stand at 2616 after the July delivery cycle. Large old crop stocks and a CBOT milling yield premium and discount schedule that is not reflective of the current trade is contributing to the record receipts and lack of cancellations.
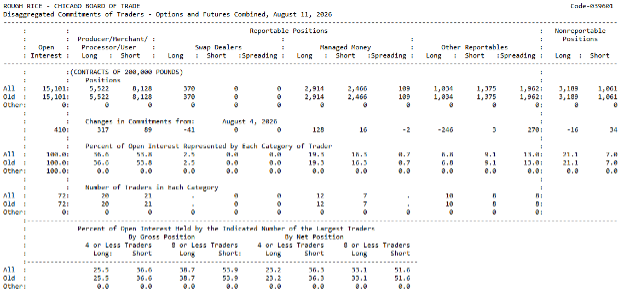
- CFTC Commitments of Traders show the fund segment less than 500 contracts net short. The commercial segment is increasing their net short position with increased farmer selling. The mid level traders are evenly split between longs and shorts and the small traders are net long over 2,000 contracts.
- USDA’s August WASDE incorporated the FSA certified acres and updated yield estimates resulting in a new long grain production estimate of 237 million bushels from the 2026 crop, a reduction of 30% from last year. Domestic use was raised slightly to 260 million bushels, however that number looks unrealistically low.
- Projected imports for the new crop year were left at 96 million bushels, a record high if correct.
- The projected ending stocks for the 2026/27 crop increased to 45 million bushels, which would still be an uncomfortably tight level of stocks.
- Milled rice prices are rising, but at a much slower pace than CBOT rough rice, thus prompting basis to weaken in the mean time.
September ‘26 Rough Rice Futures
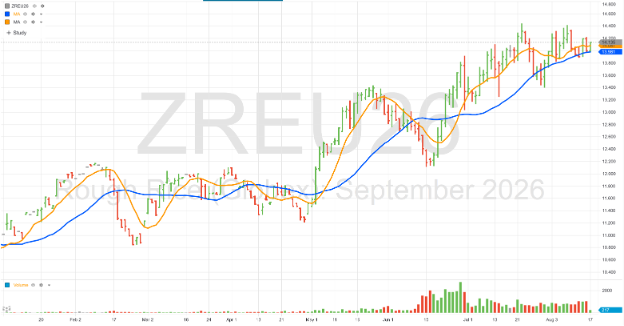
Orange Line = 9 day moving average
Blue Line = 27 day moving average
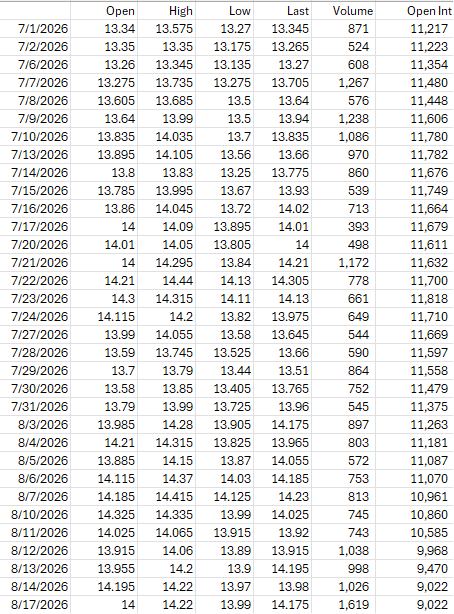
CBOT September ’26 Rough Rice Values, 7/1/26 through 8/17/26
U.S. Long Grain Rice Supply-Demand
CBOT Receipts As of 8-14-26
CFTC Commitments of Traders
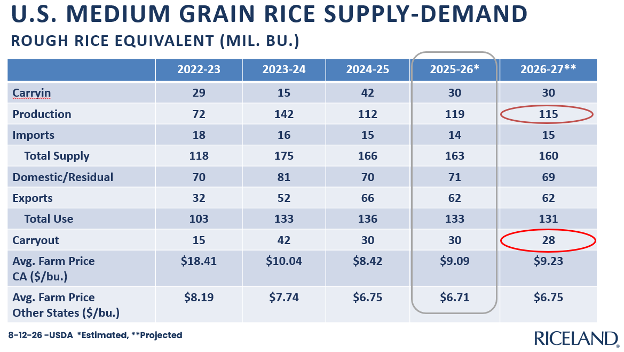
U.S. Medium Grain Rice Supply-Demand
Soybean Fundamental Highlights
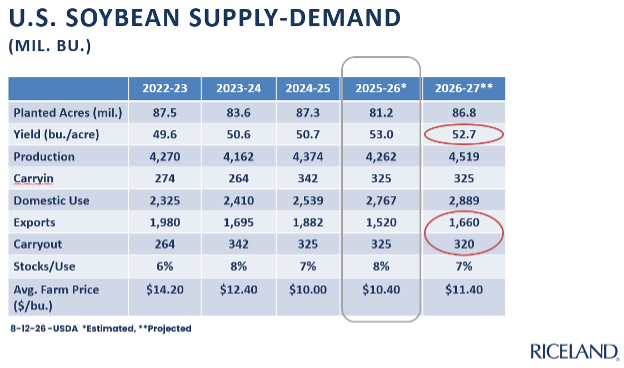
- The August 12 crop production report projected total U.S. soybean acres at 86.77 million, compared to 81.2 million last year.
- The August WASDE increased old crop domestic use by 5 million bushels, resulting in ending stocks dropping to 325 million bushels.
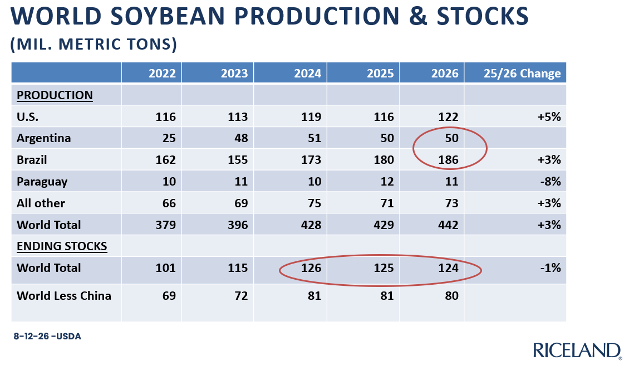
- The soybean market has been influenced by Iran war developments, Chinese purchases and corn belt weather in recent weeks. Over the next few months harvest yield reports and Chinese purchases will be the key market factors.
- The August WASDE partially offset the increased new crop production with a decrease in beginning stocks and an increase in crush. Projected new crop ending stocks were increased slightly to 320 million bushels. Ending stocks do not need to increase past this level if the market is going to hold the $12 range.
November ‘26 Soybean Futures
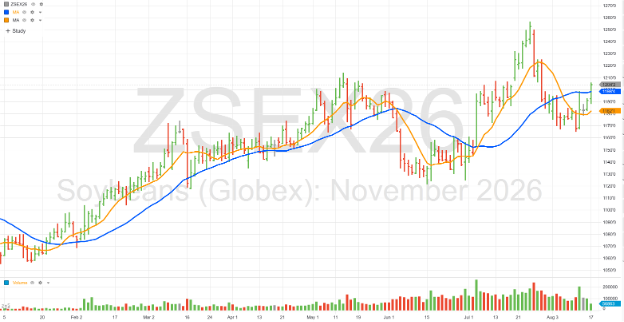
Orange Line = 9 day moving average
Blue Line = 27 day moving average
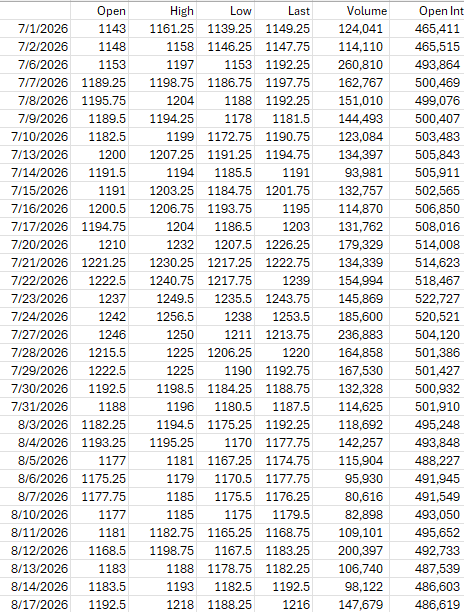
CBOT November ’26 Soybean Values, 7/1/26 through 8/17/26
U.S. Soybean Supply-Demand
World Soybean Production & Stocks
River / Weather
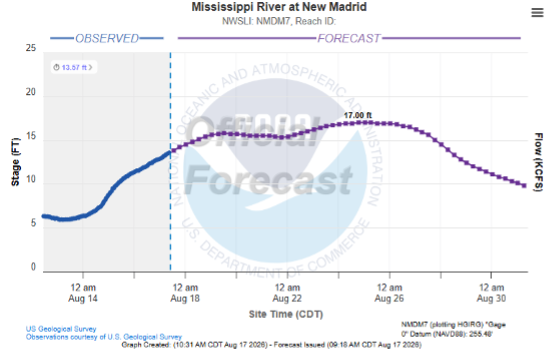
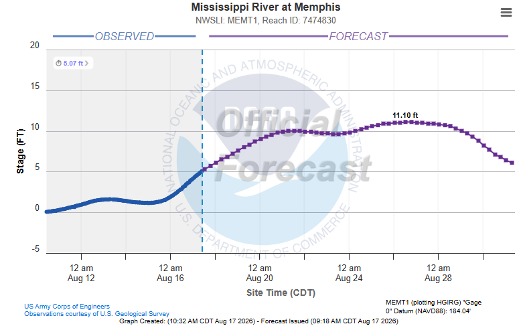
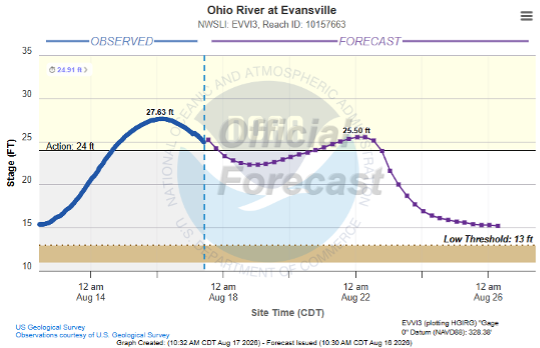
The Mississippi River graphs show rising levels after heavy rains in the Midwest. Ample water for navigation looks to be ensured at least another 3 weeks. Additional rainfall will be needed to maintain adequate levels for the last half of September.
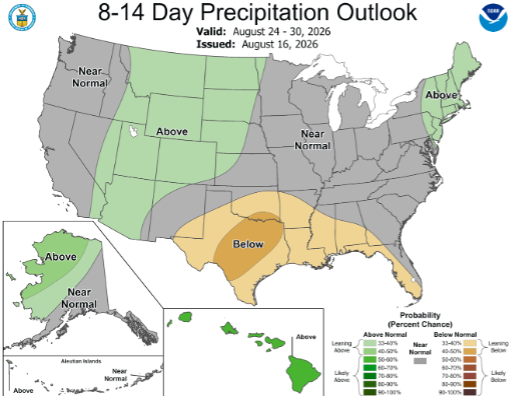
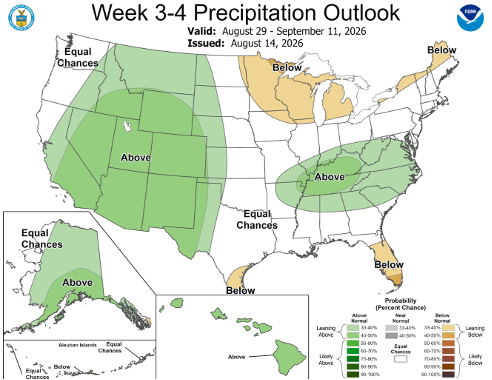
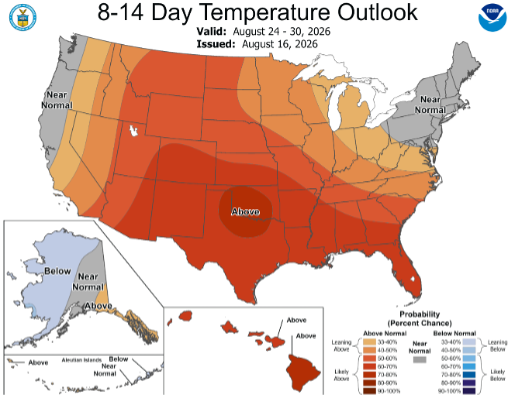
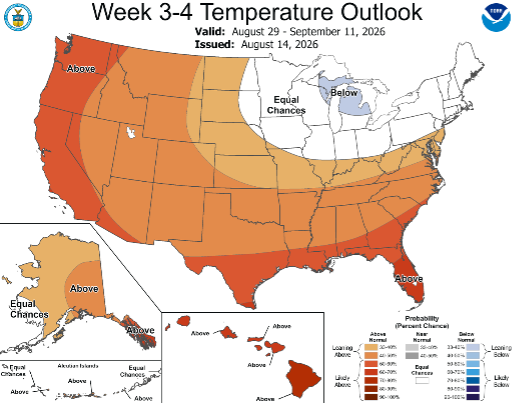
The near-term precipitation outlook shows potential for light rains in Arkansas and Southeast Missouri. The 3-4 week outlook is for above normal chances of rain for the early September time frame. Temperatures are expected to remain above normal for the next few weeks.
NWS 7 day Precipitation Forecast
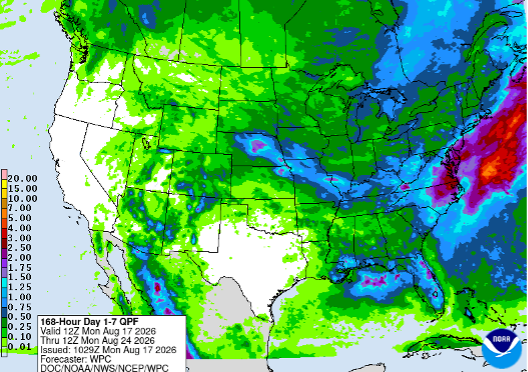
NOAA Precipitation and Temperature General Outlook